top of page
The Sustainability Advisory Committee is entrusted to tackle some of society’s toughest challenges. From climate change to resilience efforts across the City of Auburn, the committee and its partners are working to address how the community will support the next generation of growth while fostering sustainable and equitable communities.


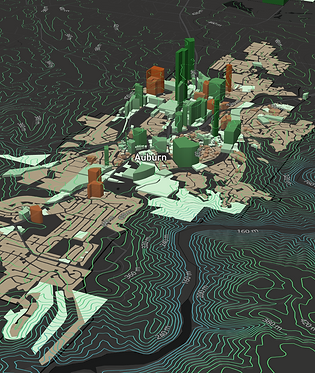
Urban data collection has advanced by leaps and bounds in recent years. Yet, it is more difficult than ever to distill this information into actionable insights to support smart, data-driven problem-solving. Gathering the data necessary to understand existing conditions and future impacts is typically an arduous and time-consuming process. This report presents maps and analyses of Auburn’s existing conditions using the program UrbanFootprint. With thousands of preloaded datasets and built-in analysis modules, UrbanFootprint helps obtain answers to complex planning questions.


One of the first steps of any planning project is a comprehensive assessment of existing conditions. This report presents existing conditions as a series of topical sections including resiliency, sustainability, and impacts of current land use. Each section begins with a description of the analysis, the data sets involved, and instructions on how to interpret the results. The following maps, graphs, and tables for each section are designed to present information at a community-wide scale and show how the data aggregates from the individual person. This method reveals the impact scale of various project opportunities in relation to each other and outlines which parcels in the City of Auburn contribute to that opportunity.
Screen Shot 2022-08-24 at 9.25.28 AM.png
Bee
Sustainably Committee’s Role

Commissioned the report from Genevieve Marsh Design Group.

Citywide Baseline Analysis

Peruse the report in the magazine viewer, order a printed copy, or download the pdf here.

Explore Maps

These maps are included for download in the Download PDF above.

Refer to the report for descriptions, ways to interpret, and sources. 

Access the Report

Base Map

Base Map

Natural Gas Use

Natural Gas Use

Total Electricity Use

Total Electricity Use

GHG Emissions per Household

GHG Emissions per Household

GHG Emissions per Employee

GHG Emissions per Employee

Existing Circulation

Existing Circulation

Circulation Bike Bus

Circulation Bike Bus

Land Use intensity

Land Use intensity

Walk to School

Walk to School

hospital walk

hospital walk

Walk to Grocery

Walk to Grocery

Walk to Park

Walk to Park

Walk to Retail

Walk to Retail

Total GHG Emissions

Total GHG Emissions

Residential Utility Cost per Household

Residential Utility Cost per Household

Transportation Cost per Household

Transportation Cost per Household

Commerical Water Use

Commerical Water Use

Residential Water Use Household

Residential Water Use Household

Walk to Transit Stop

Walk to Transit Stop

Employment Density

Employment Density

Employment and Dwelling Unit Density

Employment and Dwelling Unit Density

Dwelling Unit Density

Dwelling Unit Density

Employee Access

Employee Access

Population Access

Population Access

Walk Bike Daily Trips

Walk Bike Daily Trips

Household VMT

Household VMT

Carbon Density Natural 2

Carbon Density Natural 2

Carbon Density Buildings

Carbon Density Buildings

Watershed Integrity

Watershed Integrity

Hazard Zones

Hazard Zones

Ground Water Recharge Potential

Ground Water Recharge Potential

Agriculture

Agriculture

bottom of page